By Joshua Stabler – Energy Edge Managing Director

Changes to the Semi-Scheduled Generator Obligations

Increased obligations for Semi-Scheduled and Dispatch Targets

The new rules, due to be implemented on 12 April 2021, will increase the obligation on semi-scheduled generators to meet their AEMO dispatch targets, except for energy resource limitations.

In particular, this means that semi-scheduled generators will have to follow their dispatch targets and are not able to curtail their dispatch during negative prices without a corresponding bid. Given the increasing obligations on rebidding and late rebidding, there is a growing expectation on renewable generators to make active strategic bidding decisions in advance of the trading day.

Third party Legal Reviews

Ashurst was one of the first legal firms to publish a legal review with the following key observations:

  • Generators should consider whether any software used to optimise dispatch in response to price remains fit for purpose in light of these new rules. In doing so, they may need to:
    • rewrite generator operating procedures;
    • brief operating staff; and 
    • disable any automated systems that enable negative pricing curtailment without rebidding or waiting for an updated dispatch instruction.
  • Given the increasing prevalence of negative price periods in the NEM, stakeholders should ensure that their exposure to negative price risk and curtailment (or turn-down) risk under their PPAs is appropriately managed. 
  • Generators should remain cognisant of their obligations around rebidding under the National Electricity Rules, particularly in respect of rebids that are made during a ‘late rebidding period’ and the additional requirements that would apply.

Ashurst News and Insights: https://www.ashurst.com/en/news-and-insights/legal-updates/new-rules-clarify-dispatch-obligations-for-semi-scheduled-generators-in-australia

Managing Negative Prices as a Renewable Generator

Setting the scene for a renewable generator

Renewable generators are characterized by four important features for our discussion today:

  1. The cost of fuel is effectively zero. Solar and Wind energy resources are produced without cost and without precise control.
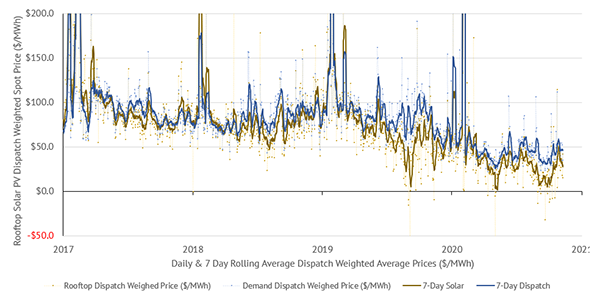
  2. Due to the value of Large-scale Generation Certificates (LGCs), which are produced by Renewable generators based on energy dispatched at node, it is standard practice for the assets to dispatch at a negative marginal price.
  3. It is not unusual for Renewable assets to have power purchase agreements (PPA) in place to help with the financing of the asset. It is also generally accepted that the PPA will have an embedded zero-strike floor option, which places the financial exposure of negative prices on the asset operator, not the PPA purchaser.
  4. Generation assets are attracted to similar locations due to the availability of renewable resources, which has been noted with the wind assets located in South Australia, Victoria and Tasmania, which are fueled by similar meteorological conditions. This means that common transmission networks can be impacted by congestion. None of these high renewable resource locations are co-located with the existing regional reference nodes.

Realistic Market Scenarios

Let’s look at four common scenarios in the electricity market that a renewable generator will need to consider (see Figure 1).

Managing Negative Prices as a Renewable Generator

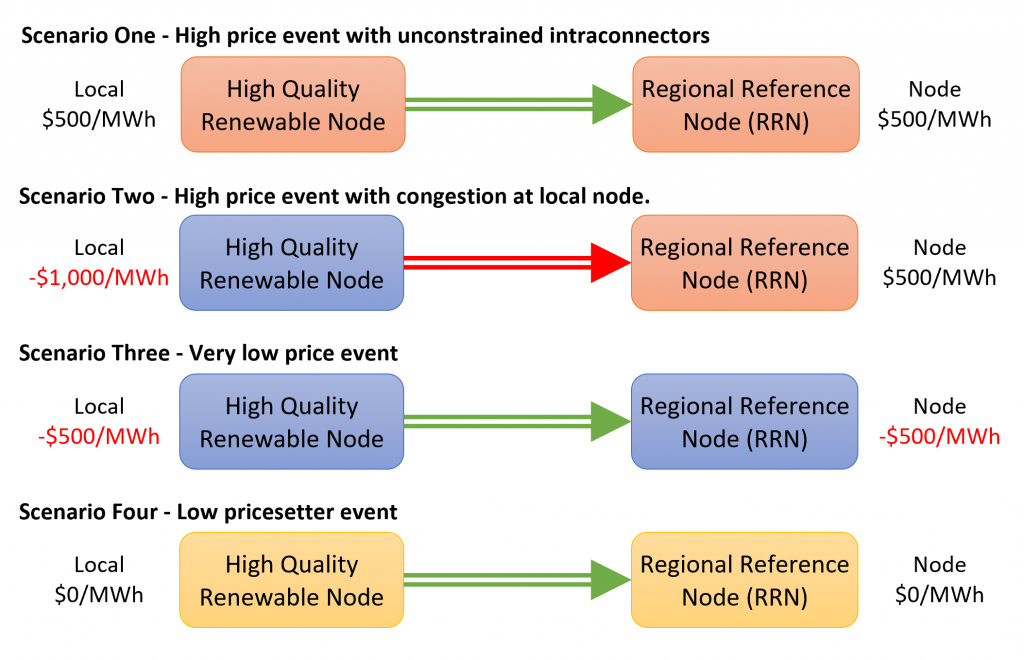
Figure 1 – Managing four market scenarios including network constraints and different local and nodal market prices

Scenario Response

Scenario One – High (or normal) price event with unconstrained interconnectors.

This is our most common scenario. The market is operating normally. There are no constraints and the market price is within its normal range.

Under these conditions, renewable generators with negative marginal costs (very low on the merit order) are highly motivated to dispatch at full capacity. However, the exact price bands (either at either the negative marginal cost or market floor) of the generator offer for dispatch will have limited direct impact on the cleared dispatch volume and settled price by the AEMO NEMDE (Market operator’s National Electricity Market Dispatch Engine).

Therefore, Generator Offers at marginal cost (say -$30/MWh), at market floor (-$1000/MWh) or at $0/MWh will also have similar financial outcomes.

Scenario Two – High price event with congestion at local node

Under the circumstances where there are network constraints which limit the ability for the energy from local generators to reach the regional reference node, a local generator is motivated to offer their dispatch at the market floor price (-$1,000/MWh) in order to maximise their dispatch.

That is, if the shadow price for the region is -$1000/MWh, any assets with offers at their fuel cost (-$30/MWh) will be targeted to zero dispatch. The remaining assts that offered their volume at the market floor price floor will be dispatched subject to the price breaker rules (i.e. pro-rata dispatch).

So for the same price conditions at the node for Scenario One and Scenario Two, we see different bidding behaviour strategies.

Scenario Three – Very low price event

Under the circumstance where both the local and regional reference node prices are substantially negative, the motivations of the generators will change. If the renewable asset has market exposure to negative prices (due to negative embedded floor or due to spot exposure), the asset is motivated to limit their dispatch to avoid the real cost of the energy market (i.e. paying to generate).

Therefore, if a generator has offered their energy at their fuel cost, they will be scheduled offline. Whereas any generators that offered their dispatch at the market floor price will be still receiving dispatch targets as well as the newly minted obligation (as of 12 April 2021) to dispatch to meet those targets.

We have now split the operational behaviour of the renewable generators between competing for dispatch during local negative market prices based on the regional reference price and the misalignment between the two regions.

Scenario Four – Low price setter event

The scenario four conditions provide an alternative scenario, which is dependent on the pool exposure of the individual participants. If the market price is being set by the generator assets at their marginal cost (i.e. -$30/MWh), there is a potential volume / price trade-off that could be considered.

Under this hypothetical scenario, it is potentially possible for the generator to withdraw some of their dispatch capacity and place it at a higher price band, potentially causing the market price to rise (potentially from not at all to substantially) and, therefore, potentially increase the pool gross margin for the business.

This type of behaviour has been historically exercised by large incumbent businesses where the pool exposures and power station volume have been more substantial, and the gross margin pay-off between lost pool exposure and higher gross margin revenue is considerable.

Responding to the market signals

One of the major complexities of the four scenarios is the ability to forecast the market conditions and decide the appropriate trading strategy to incorporate in advance of the conditions and having the confidence that your bidding behaviour is appropriate in a five minute market.

Energy Edge Electricity Forecasting Service (EFS)

Energy Edge have developed the Electricity Forecasting Service (EFS) which provides a seven-day ahead spot price forecast for each region based on key methodology assumptions defined by the client.

Rather than the deterministic bottom-up modelling systems which require a declaration of the capacity of complex power stations on a unit-by-unit basis, the EFS uses a market generalization with a top-down approach based on a definable training period for the forecast outcomes.

Short Term: Seven Day Forecast

The EFS has an automated daily forecast for the next seven-days sent to your email inbox each morning which incorporates updates to the Short Term Projected Assessment of System Adequacy (STPASA) availability, demand and market conditions.

Using the forecast spot prices, renewable generators will be able to anticipate the market conditions and which of the above market scenarios that the business needs to manage. The Short Term EFS is currently available for client subscription right now (Electricity Forecasting Service).

Medium Term and Long Term Forecast

Energy Edge is in the process of transferring the core methodology of its medium-term and long-term forecast and data controls into the same automatic systemic functionality as the short term forecast.

The Medium Term Forecast will incorporate the recent extension of the Medium Term Projected Assessment of System Adequacy (MTPASA) to a three-year horizon, whereas the Long Term Forecast will incorporate the macro assumptions like investment cycles. The Medium Term EFS and Long Term EFS will be available to clients during late 2021.

What can you do next?

Contact Us to find out more about our electricity forecasting service and how it can help you make confident decisions in the electricity market ahead of time.

By Joshua Stabler – Energy Edge Managing Director

Linked Articles: The Rise and Rise of Rooftop Solar

The trajectory of the development of battery solutions within Australia is shaping up to be one of the defining questions for the Australian energy market during the 2020’s and there are many evolving conditions that drive this statement. While the growth of this sector feels inevitable, there are still challenges ahead. Orderly transition is not assured and the cost of disorderly transition should not be underestimated.

The Complexity

Firstly, the capital costs of batteries are continuing to decline rapidly due to steep learning curve improvements, equivalent to technologies like solar. While falling costs should be a keen benefit for the technology class, it does create a deflationary conundrum: Do you buy now? Or wait until later when it is cheaper?

Figure 1 – Breakeven Revenue Ratio for Large Scale Storage (Source: NREL, Lazard, Energy Edge)

Secondly, the avenues to market for batteries are broadening:

  • Large Scale Batteries are characterised by their access to economies of scale, although revenues are based on the arbitrage in the wholesale markets and Frequency Control Ancillary Services (FCAS) markets.
    • The early adopters will capture the highest revenues due to the least competition in this space, but these same assets will also be burdened with the highest ongoing capital costs (due to the falling cost curves).
    • The next wave of competition joins the market favoured with a lower cost structure and reciprocally lower revenue threshold.
    • The large-scale batteries compete with Pump Storage Hydro (or ‘shallow storage’ as per AEMO ISP definition) (further on this below).
  • Residential Batteries are based behind the meter and their primary economic benefit is derived from the arbitrage between residential peak tariff and the solar feed-in tariff.
    • This market is being driven by the growing systemic arbitrage between the higher evening peak tariff and the decline in the fair value of the solar feed-in tariffs (see The Rise and Rise of Solar Rooftop).
    • One of the finer details here is that the wholesale energy price only makes up 30-40% of the residential tariff, which provides a systemic competitive advantage against large scale batteries (which must extract value from the wholesale market).
    • The current range of technology (Tesla Powerwall) has a capacity of 13.5kWh.
  • Electric Vehicles (EV) sharply increase the efficiency of transportation through the introduction of electric engines.
    • In terms of efficiency, a Tesla 3 Long Range has a range of 637km based on 82kWh (290MJ) and a Toyota Camry (4-cylinder petrol) has a rated fuel efficiency of 8.3L (284MJ) per 100km. Therefore, a Tesla can provide 6.24x the travelled distance for the same energy content.
    • Assuming the average annual residential car utilisation of 12,607km and a petrol price of $1.30/L, that is a potential saving of $1,142 p.a. based on fuel efficiency alone.
    • However, a Toyota Camry also costs $29k to $39k compared with the $83k for a Tesla 3 Long Range so the benefits from fuel consumption do not yet solve the economics challenge alone.
    • Finally, the Tesla 3 Long Range (82kWh) has 6x the energy storage capacity compared with the Tesla Powerwall (13.5kWh) at around 6x the price ($82k vs $13-15k), so the cost per kWh is the same.

AEMO Path Forward

AEMO’s Integrated System Plan (ISP) gives a vision of five potential paths forward for the Australian electricity market including:

  • Central: the pace of transition is determined by market forces under current federal and state government policies.
  • Slow Change: a slow-down of the energy transition, characterised by slower changes in technology costs, and low political, commercial, and consumer motivation to make the upfront investments required for significant emissions reduction.
  • High Distributed Energy Resources (DER): more rapid, consumer-led transition, as consumers take control of their energy costs with easy-to-use, interactive technologies, falling costs for DER and EVs.
  • Fast Change: a more rapid technology-led transition, its costs reduced by advancement in grid-scale technology and targeted policy support. There is coordinated national and international action to reduce emissions leads to innovation, automation, the accelerated exit of existing generators, and greater electric transport.
  • Step Change: both consumer-led and technology-led transitions occur in the midst of aggressive global decarbonisation and strong infrastructure commitments.

The following graphics shows two of those five paths with the Central case (Figure 2) and the High DER case (figure 3) where it can be noted that anticipated storage capacity for the Central case at 2040-41 (14GW) is the equivalent goal as 2027-28 in the High DER case.

AEMO Integrated System Plan 2020 - Storage Investment - Central Case

Figure 2 – AEMO Integrated System Plan 2020 – Storage Investment – Central Case

AEMO Integrated System Plan 2020 - Storage Investment - High DER Case

Figure 3 – AEMO Integrated System Plan 2020 – Storage Investment – High DER Case

The different paths for batteries are very dependent on the continued growth of correlated solar and wind generators (as noted in our previous The Rise and Rise of Rooftop Solar) and the requirement to transiently shift capacity between the peaks and troughs of both diurnal and seasonal demand shapes.

However, the exact shape and technology of the storage solution is not etched in stone. The demand on the continued progression down the technology learning cost curves remains critical and the incentives for competitive alternative breakthroughs have never been higher.

After all of this article and the clear expectations on batteries, where is the complexity? Well, batteries only offer a path to an orderly transition if it can be achieved commercially. Without that final stipulation, it is just a dream.

Energy Edge releases our Short Term Electricity Forecasting Service (EFS)

Contact Us to Learn More.

A long time in the making, Energy Edge is proud to announce our Short Term Electricity Forecasting Service (EFS). Through automatic training of the macro market conditions, the EFS is able to quickly incorporate shifting market fundamentals. The following graphic shows the 46 daily outputs of our week-ahead forecast for the Queensland, New South Wales and Victorian electricity markets between 25 September and 10 November 2020.


Queensland

Review of Queensland Forecasts for the period of 25 September 2020 to 10 November 2020
Actual Spot Price: $35.04/MWh
Forecast Spot Price: $31.99/MWh

New South Wales

Review of New South Wales Forecasts for the period of 25 September 2020 to 10 November 2020
Actual Spot Price: $54.71/MWh
Forecast Spot Price: $50.91/MWh

Victoria

Review of Victoria Forecasts for the period of 25 September 2020 to 10 November 2020
Actual Spot Price: $44.50/MWh
Forecast Spot Price: $44.70/MWh

Please contact Josh (jstabler@energyedge.com.au) for further information.

Q4 2020 The Edge – Energy Market Reports topics

Energy Edge has recently published The Edge – Energy Market reports.

19 October 2020 Edge Report (Subscriber Link)

Investigations into the renewable generation sector including:
  • assessment of solar spillage via congestion and/or constraints for Queensland solar assets including recent security constraints;
  • correlation matrix for wind assets across the east coast and the implications on regional spot market outcomes;
  • calculation of renewable learning curves including historical and projected cost structures for solar and wind; and
  • Management of the constraints and deflationary pressures on the future of solar and wind as well as the potential solutions. It is a complicated issue.

27 October 2020 Edge Report (Subscriber Link)

  • In advance of the Origin Energy Quarterly Production Report (link) due out 31 October and utilising public information within Energy Edge’s Gas Market Analysis Tool (GMAT) to calculate Origin’s share of the APLNG LNG Revenue for the Q3-2020, as well as the rest of the asset.
  • We look at the movements in the JKM market and the different ways of reporting between Prompt Month and forward period (Cal-2021).
  • Update on the drilling programs for each of the major surat producers.

18 November 2020 Edge Report (Subscriber Link)

  • Review of the accuracy of our estimates of Origin Energy’s share of the APLNG LNG Revenue and the initial estimates of Q4-2020 outcomes; and
  • Preview of our upcoming MTPASA DUID Review Tool including a clear timing of the exit of Liddell #4.

1 December 2020 Edge Report (Subscriber Link)

  • LNG export records (Featured Image)
  • International and domestic gas prices alignment and the premiums between JKM Netback and Victorian gas markets;
  • Investigations into Queensland gas exports, Iona storage and deeper and revealing look at the Moomba Gas Storage facility;
  • Analysis of Otway and Longford in terms of daily flows and calendar contract year volumes as well as the recent outages;
  • Electricity price distribution analysis using cap contract premium slivers; and
  • Finally some concluding thoughts on this list on this market dynamics.

15 December 2020 Edge Report (Subscriber Link)

  • Negative Electricity Prices Analysis – 60 of 63 half hours of negative prices in South Australia between 5th and 7th December
  • Regional comparsion of high price (>$300/MWh) and negative price (<$0/MWh) volatility over time
  • Further assessment of the time of day negative prices over past four years for Queensland and South Australia
  • Update on the WHO weekly Influenza cases and testing across the entire planet.

18 December 2020 Edge Report (Subscriber Link)

  • New Record! Curtis LNG Exports looking to reach 26.6mtpa or +6% above Curtis Island Nameplate capacity (25.4mtpa)
  • International Gas Prices spiked to USD$10.63/MMBTU driven by cold Northern Asian Winter lifting gas demand
  • The relationship between domestic gas prices and international JKM has been visualised with a domestic premium/discount graphic since 2019
  • Relationship has been extended to the Brent Oil slope vs JKM and domestic market outcomes to identify different oil-on-gas vs gas-on-gas behaviours

Please contact Josh (jstabler@energyedge.com.au) for further information.

Energy Edge joins the DISER Tender Panel

Energy Edge joins the Australian Federal Government Department of Industry, Science, Energy and Resources (DISER) Energy Business and Technical Services Panel.

Energy Edge will be providing services on:

  1. Policy, Technical and Strategic Advice (Consulting and Advisory)
  2. Research and Analysis (The Edge Reports)
  3. Industry training and facilitation (Training)
  4. Compliance and monitoring (Compliance and Regulation)
  5. Response to the impacts of COVID-19/pandemics on the energy sector and consumers in Australia (Consulting and Advisory)

Please contact Josh (jstabler@energyedge.com.au) for further information.

AusTender Standing Offer Notice View

By Joshua Stabler – Energy Edge Managing Director

Linked Articles: Orderly Transition: The complex case of residential batteries

NEM Rooftop Solar Conditions

Rooftop Solar MW

Figure 1: Rooftop Solar Contribution to Total Demand – At Noon

With abundant sunshine as well as rooftops, Australia has pushed the bleeding edge of the rooftop solar with nearly 2.6 million installations (CER). Looking at the NEM wide impact, the consistently rising contribution of rooftop solar to the NEM supply side at noon each day has been illustrated in terms of energy dispatch (Figure 1) and the percentage contribution (Figure 2). The seven day rolling average peaked in recent days in excess of 25% of energy requirements during the middle of the day.

Rooftop Solar Contribution

Figure 2: Rooftop Solar Contribution (%) of Total NEM Demand – At Noon

This rapid increase in a non-discretionary supply side generation (i.e. residential solar is unaware of the wholesale market) has impacted the electricity market outcomes. This has been noted in both the solar volume weighted average prices (VWAP) shown in Figure 3 and the dispatch weighted price ratio (Solar VWAP / Demand VWAP) shown in Figure 4. NEM

Rooftop Solar VWAP - SA

Figure 3: Solar Volume Weighted Average Price (VWAP) vs Demand VWAP – Daily

NEM Rooftop Solar VWAP Ratio

Figure 4: Solar Volume Weighted Average Price (VWAP) as ratio (%) of Demand VWAP – Daily

South Australia Rooftop Solar Conditions

South Australia has pushed the bounds of new renewables (solar and wind) beyond any region in the world, and this is true with residential uptake of rooftop solar. This uptake of rooftop PV has been clearly illustrated in terms of rooftop energy dispatch (Figure 5) and rooftop energy % contribution (Figure 6), where it has recently topped out at more than 75% of the local demand.

Rooftop Solar MW - SA

Figure 5: South Australia Rooftop PV Contribution (MW) to Regional Demand – At Noon

Rooftop Solar Contribution - SA

Figure 6: South Australia Rooftop PV Contribution (%) to Regional Demand – At Noon

The sharp increase on the supply side has resulted in consistently negative price outcomes during the September – October milder weather shoulder periods as noted in Figure 7.

NEM Rooftop Solar VWAP

Figure 7: South Australia Volume Weighted Average Price (WVAP) vs Regional VWAP – Daily

In fact, during the 43 days between 29 August and 10 October 2020, there was only 17 days were the average solar dispatch price was positive (Figure 7). That is, during the 26 other days, the average dispatch price for rooftop solar was (negative) -$51.1/MWh.

Even over the past twelve months which allows for the peak summer and winter periods, the volume weighted dispatch spot price of the rooftop solar in South Australia has only averaged $37.40/MWh ($0.037 /KWh), while the regional VWAP has been $57.98/MWh.

It should be noted that the solar feed-in is further concentrated to the middle of the day when in-house consumption is lower, allowing more solar to be exported… which coincides with the lowest prices.

This does not bode well for the future fair-value price of rooftop solar exports to the market for all residentials (i.e. Feed-in Tariffs) for either South Australia, or anywhere in Australia.

What Our Clients Have To Say

I have engaged Energy Edge for a number of projects ranging from Subject Matter Expert Project Managers through to the design, development and implementation of electricity and gas trading support and risk management software and assisting in the establishment of the energy trading function. I have found the team possess the industry experience, tailored insights and commitment to task completion that resulted in their professional delivery of these projects. I would definitely consider using Energy Edge in future energy trading related projects.

Tanya Mills
Former General Manager Customer & Energy Markets
CleanCo Queensland

Energy Edge has supported one of our successful energy infrastructure acquisitions by providing significant subject matter expertise into the energy market conditions, and detailed analysis of the behaviour of critical participants. Energy Edge worked seamlessly with our lead investment bank and contributed the key industry knowledge to make sure the acquisition considered all potential value propositions. We have continued to maintain an ongoing strategic relationship and would recommend them to any local or international parties.

James Ward
Investment Director
Palisade Investment Partners

Energy Edge has completed a number of projects for Stanwell including the design, development, implementation and support of At-Risk and Hedge Accounting systems, and have worked within Stanwell as embedded resources while also leading our STTM Readiness Project, our Carbon Readiness Project and our Retail Project. The ease of working with Energy Edge is due to their accumulated knowledge obtained whilst working within energy trading companies themselves. They know the energy markets.

Carl Malouf
General Manager, Quantitative Risk and Analytics
Stanwell Corporation

Energy Edge has provided analytical and risk expertise and system support for InterGen Australia for a number of years. Energy Edge’s ability to work closely with members of the Risk, Trading, IT and broader Finance team in a flexible, long-term collaboration has enabled us to achieve improvements in our processes and a complete re-design and build of the risk systems to support our trading operation. Their skills and knowledge enable them to work closely with our business and I would highly recommend Energy Edge to any party.

Sam Watson-Will
Head of Market Risk
InterGen (Australia) Pty Ltd

Keep Up To Date

Sign up to Energy Edge communications today
to hear our latest news